Beyond console.log: Enhancing Observability Through Better Logging
My first post — and a topic I care deeply about.
Every engineer has been there: it's 2 AM, production is on fire, and the only clue you have is a log line that says Error: something went wrong. That moment is usually when teams realize that logging isn't a checkbox — it's a discipline. In this post, I'll walk through how logging fits into the broader picture of observability, and share practical enhancements you can apply today.
Observability vs. Monitoring: What's the Difference?
Monitoring tells you when something is wrong. Observability helps you understand why.
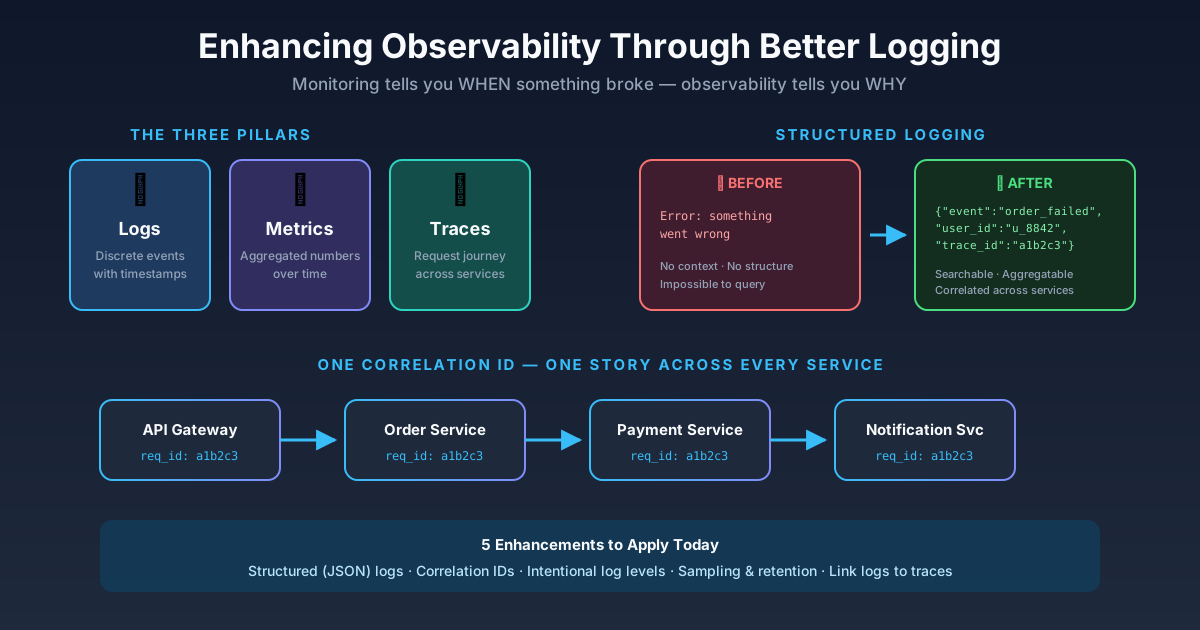
Monitoring is built on known failure modes — you define a threshold ("alert me if CPU > 90%") and wait. Observability, on the other hand, is about being able to ask arbitrary questions of your system without shipping new code. It rests on three pillars:
- Logs — discrete, timestamped records of events
- Metrics — aggregated numerical measurements over time
- Traces — the journey of a single request across services
Logs are usually the first pillar teams adopt, and also the one most often done badly. Let's fix that.
The Problem With Traditional Logging
Most codebases accumulate logs organically. The result looks like this:
Processing started
User found
Error: something went wrong
Done
The problems are obvious once you name them:
- No structure. These lines can't be filtered, aggregated, or queried meaningfully.
- No context. Which user? Which request? Which environment?
- No correlation. In a distributed system, you can't stitch these lines together into a single request's story.
- Wrong signal-to-noise ratio. Critical failures drown in a sea of "Processing started."
Enhancement 1: Structured Logging
The single highest-impact change you can make is switching from free-text logs to structured (usually JSON) logs.
Before:
logger.info(f"User {user_id} placed order {order_id} for ${amount}")After:
logger.info("order_placed", extra={
    "user_id": user_id,
    "order_id": order_id,
    "amount": amount,
    "currency": "USD"
})
Which produces:
{
  "timestamp": "2026-08-15T09:32:11Z",
  "level": "INFO",
  "event": "order_placed",
  "user_id": "u_8842",
  "order_id": "ord_5511",
  "amount": 249.99,
  "currency": "USD"
}
Now your log platform (Elasticsearch, Loki, CloudWatch, Datadog — pick your poison) can answer questions like "show me all failed orders over $200 in the last hour, grouped by region" in seconds instead of hours of grep archaeology.
Enhancement 2: Correlation IDs
In a microservices world, a single user click might touch ten services. Without a shared identifier, each service's logs are an island.
The fix: generate a correlation ID (or trace ID) at the edge — your API gateway or load balancer — and propagate it through every downstream call, usually via an HTTP header like X-Request-ID or the W3C traceparent header.
# Middleware example (FastAPI)
@app.middleware("http")
async def add_correlation_id(request, call_next):
    request_id = request.headers.get("X-Request-ID", str(uuid4()))
    with logger.contextualize(request_id=request_id):
        response = await call_next(request)
        response.headers["X-Request-ID"] = request_id
        return response
Now every log line carries the request ID automatically, and one query reconstructs the full story of any request across your entire stack.
Enhancement 3: Log Levels With Intent
Log levels only work if your team agrees on what they mean. A convention I recommend:
- DEBUG — detail useful only during active development. Off in production by default.
- INFO — business-meaningful events: order placed, user registered, job completed.
- WARN — something unexpected happened, but the system recovered. Retries, fallbacks, deprecated API usage.
- ERROR — an operation failed and needs attention. Every ERROR should be actionable.
- FATAL/CRITICAL — the service cannot continue.
The golden rule: if an ERROR log doesn't require someone to potentially do something, it's not an ERROR. Alert fatigue starts with sloppy log levels.
Enhancement 4: Sampling and Cost Control
Verbose logging at scale gets expensive fast — both in storage costs and in query performance. Two strategies help:
- Level-based retention: Keep ERROR logs for 90 days, INFO for 14, DEBUG for 1 (or not at all in prod).
- Dynamic sampling: Log 100% of errors, but only 1–5% of successful high-volume events. Tools like OpenTelemetry support tail-based sampling, which keeps a full trace whenever any part of it errored.
Enhancement 5: Connect Logs to Traces
This is where logging graduates into true observability. By embedding the trace ID and span ID into every log line, your observability platform can jump from a slow trace directly to the exact logs emitted during that span — and back.
With OpenTelemetry, this is nearly free:
from opentelemetry import trace

span = trace.get_current_span()
ctx = span.get_span_context()
logger.info("payment_failed", extra={
    "trace_id": format(ctx.trace_id, "032x"),
    "span_id": format(ctx.span_id, "016x"),
    "reason": "card_declined"
})
Once logs, metrics, and traces share identifiers, debugging changes character: instead of hunting, you navigate.
A Few Anti-Patterns to Avoid
- Logging sensitive data. PII, passwords, tokens, full card numbers — scrub them at the logging library level, not by hoping developers remember.
- Logging inside tight loops. One log per item in a 100k-item batch will hurt you.
- Swallowing exceptions with a bare log.
except Exception: logger.error("failed")destroys the stack trace. Always log the exception object. - Treating logs as your only pillar. Some questions (p99 latency trends, error-rate SLOs) are better answered by metrics.
Where to Start Tomorrow
If your current setup is unstructured text logs, here's a pragmatic rollout order:
- Adopt a structured logging library (structlog, pino, zerolog, logback with JSON encoder — whatever fits your stack).
- Add correlation IDs at your edge and propagate them.
- Audit your log levels against the conventions above.
- Instrument with OpenTelemetry and link logs to traces.
- Set retention and sampling policies before the storage bill sets them for you.
Observability isn't a product you buy — it's a property of your system that you build, one well-structured log line at a time.
Thanks for reading my first post! I'd love to hear how your team approaches logging — reach out or leave a comment.